Getting Started with Dataverse Plugins - Part 4
- May 24
- 7 min read
Unlike the last three posts in this series, which followed on from each other and worked towards building and deploying plugins into Microsoft Dataverse, this post will instead cover a few handy things to know when working with plugins. The topics in this post don’t follow on from each other; they are independent actions, which may be useful to know as you get into plugin development. If you’ve not already read the previous three instalments in this series, and want to know more about getting started with plugin development, the links to these can be found below:
Adding Plugins into Solutions
If you’re following best practice by, developing apps in one environment, testing in another and having the end users access them in another, then this one will be good to know. When you create a plugin and load this into a Dataverse table, the plugin doesn’t automatically get added into any solution(s) your app, tables and other components are part of. Also, unlike many dependencies, you’ll not be prompted to add your plugin if it’s missing from the release. So, you’ll likely build your plugin in development and find it works fine there and then in your test environment, you’ll notice the behaviour it should introduce isn’t present. This is because it never made it into the test environment in the first place. Before a solution is moved between environments, you’ll need to ensure you’ve added any assemblies, plugins and steps into the solution.
Begin by going into the solution, where you will see nothing listed for our plugin:

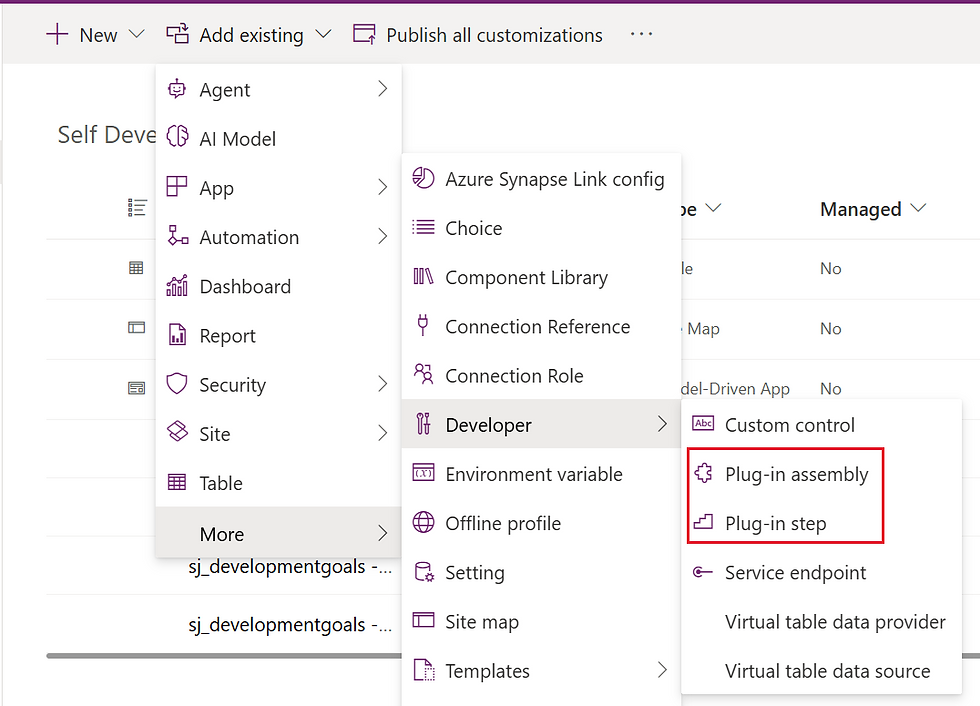
Then, go to ‘Add existing’ > ‘More’ > ‘Developer’ and here you will see our two options to add in both our assembly and step.
First, select to add an assembly and then locate your assembly in the list, finally adding this into the solution.

Then, do the same for the one or more steps you have created.

With both added, you should then see them visible in the solution and ready to move to another environment.

Updating a Plugin
Now and then, you’ll need to add updates to your assembly, this might be bug fixes, enhancements to existing plugins or adding new plugins to the assembly. To do this, you will need to run an update of the assembly. Start this by opening the Plugin Registration Tool and connecting to your development environment. You can find instructions on working with the Plugin Registration Tool in the previous instalment in this series.
Once connected to your environment within the Plugin Registration Tool, find the assembly you wish to update, right-click on the assembly and select ‘Update’.

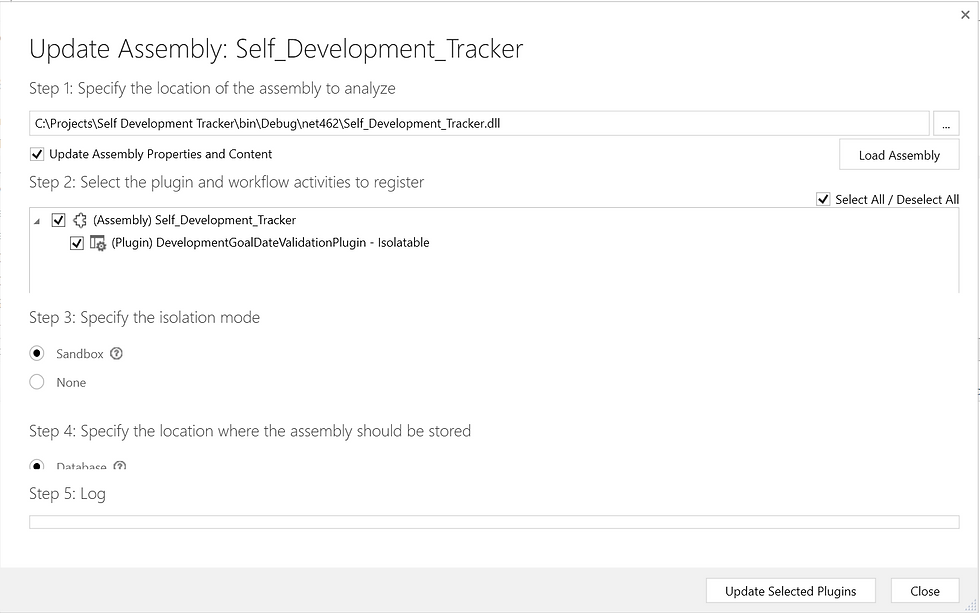
Next, click on the ellipsis under step one and locate the main .dll file for your plugin. This will be under your project at: ‘/bin/Debug/net462/’ and will be called the same as your project, with .dll at the end. If your project name has spaces, then these will be replaced by underscores in the project name. Once located, select the .dll file and click ‘Open’.

Under step two, select the items you want to update – it’s usually safer just to update them all. You can leave the other settings as ‘Sandbox’ and ‘Database’ and then click ‘Update Selected Plugins’.
You should see a message telling you the update has been successful.

Creating Pre-Images
Something you may come across, depending on the type of plugins you create, is the need to create pre-images. If AI is helping you with the coding side of things, it should tell you when a pre-image is needed and what to call it, as it will be referenced in the code. Think of a pre-image as a snapshot of the records previous values. An example here may be that in the post-operation stage, within a synchronous pipeline, a value of a field before and after the update may be needed for something, such as sending a message to the previous owner of a record that their record is now owned by someone else. As the update overwrites the values, this wouldn’t be possible to do after the update, without creating a snapshot of the key data before the update takes place. This snapshot is achieved by creating the pre-image. You can create a pre-image by opening up the Plugin Registration Tool and connecting to your development environment. You can find instructions on working with the Plugin Registration Tool in the previous instalment.
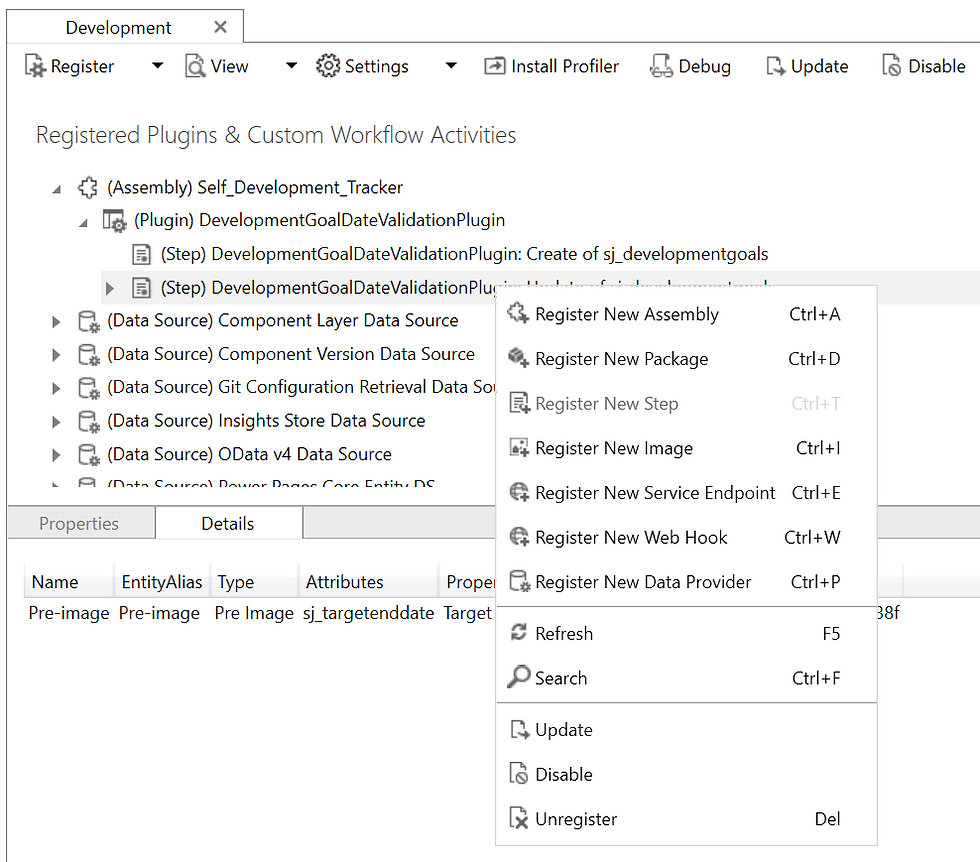
Once connected to your environment within the Plugin Registration Tool, find the step which requires the pre-image, right-click on the step and select ‘Register New Image’.

Ensure the pre-image box is ticked, provide a name and alias for your image. As mentioned previously, if you’re using AI to write your code, it will usually provide this detail for you. Finally, if you only want to snapshot one or two fields rather than all of them, you can use the 'Parameters' field to specify these. Limiting what the snapshot captures is just another one of those little things we can do to help with the performance of our apps.

Once you’ve filled in the details, click ‘Register Image’ and you will then see this appear below the relevant step.

Debugging
On occasions, you’ll hit problems with your plugins, such as when they throw up an error in your app. You’ll also find that, in a lot of cases, those errors aren’t the most useful, but a combination of plugin trace logging and AI should help to get to the bottom of what is causing the error. Trace logging will help give you the detail you need to understand what has gone wrong with a plugin, but in most cases, you’ll need to switch this on first. So, you’ve had an error which you suspect is caused by your plugin. While you’re inside the app that fires the plugin, go to the cog at the top-right corner and click ‘Advanced Settings’.

In the window which opens, go to ‘Administration’ and ‘Customization’.

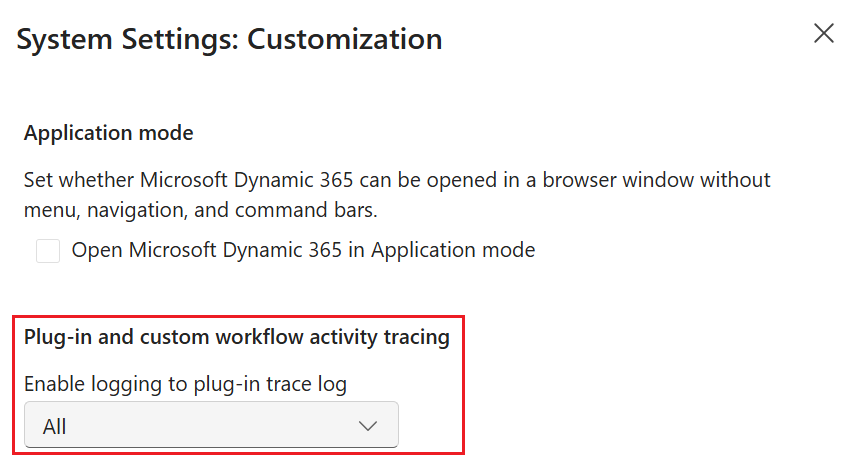
In the Customization window set ‘Enable logging to plug-in trace log’ to ‘All’. This will then switch on logging.
With tracing enabled, you now need to recreate the error in order for the tracing log to catch the detail. Recreate the error and then click back on the cog at the top-right of your screen. This time, in the navigation on the left, select ‘Plug-In Trace Log’. You will then be presented with the details it has captured since tracing has been switched on.

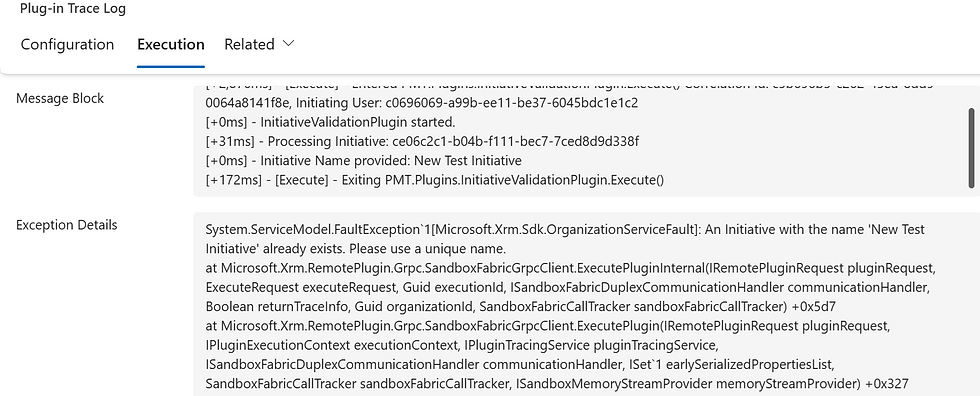
To see more detail on each individual trace, click onto the ‘Type Name’ of the entry, go to the ‘Execution’ tab within the record and here you will be able to see the exception details.
If you have the AI chat that originally wrote the C# for your plugin, you could add the exception detail here, which AI can review and correct. This may then require an update to the plugin and an update to the assembly, which can be done using the steps above in the ‘Update a Plugin’ section.
Deleting a plugin
To remove any element of an assembly, such as the steps, plugin or the assembly itself, you can simply open the Plugin Registration Tool, locate the assembly where you want to remove items and then right click on them and click unregister.

The thing to remember is that items need to be removed in order so, your plugin steps will need to be unregistered first and then the plugin can be unregistered.
Finally at the end
We’ll leave it there as hopefully the four instalments in this series will be enough to get you up and running with plugins.
On a final note, it’s worth me making the point that AI really can be your friend when it comes to developing plugins. If given the right information AI can write the code you need in seconds and in most cases, if I’ve given it the right description of what I want the code to do, the code it's produced has worked first time without the need for further refinement or debugging. Using AI as part of this process can help you if you’re not familiar with C# and even if you are, it can significantly speed up the development process.
In the blogs to follow I’ll be writing more about AI, how I use it and why I think it’s such a great tool, if used in a collaborate way. Until then!


Comments